Chart Element
Overview
Added in Enfold 5.3, the Chart element is an easy way to display static data to your site visitors in a graphic manner.
The element is based on Chart JS and the necessary js file is bundled. So there is no access to any external resource.
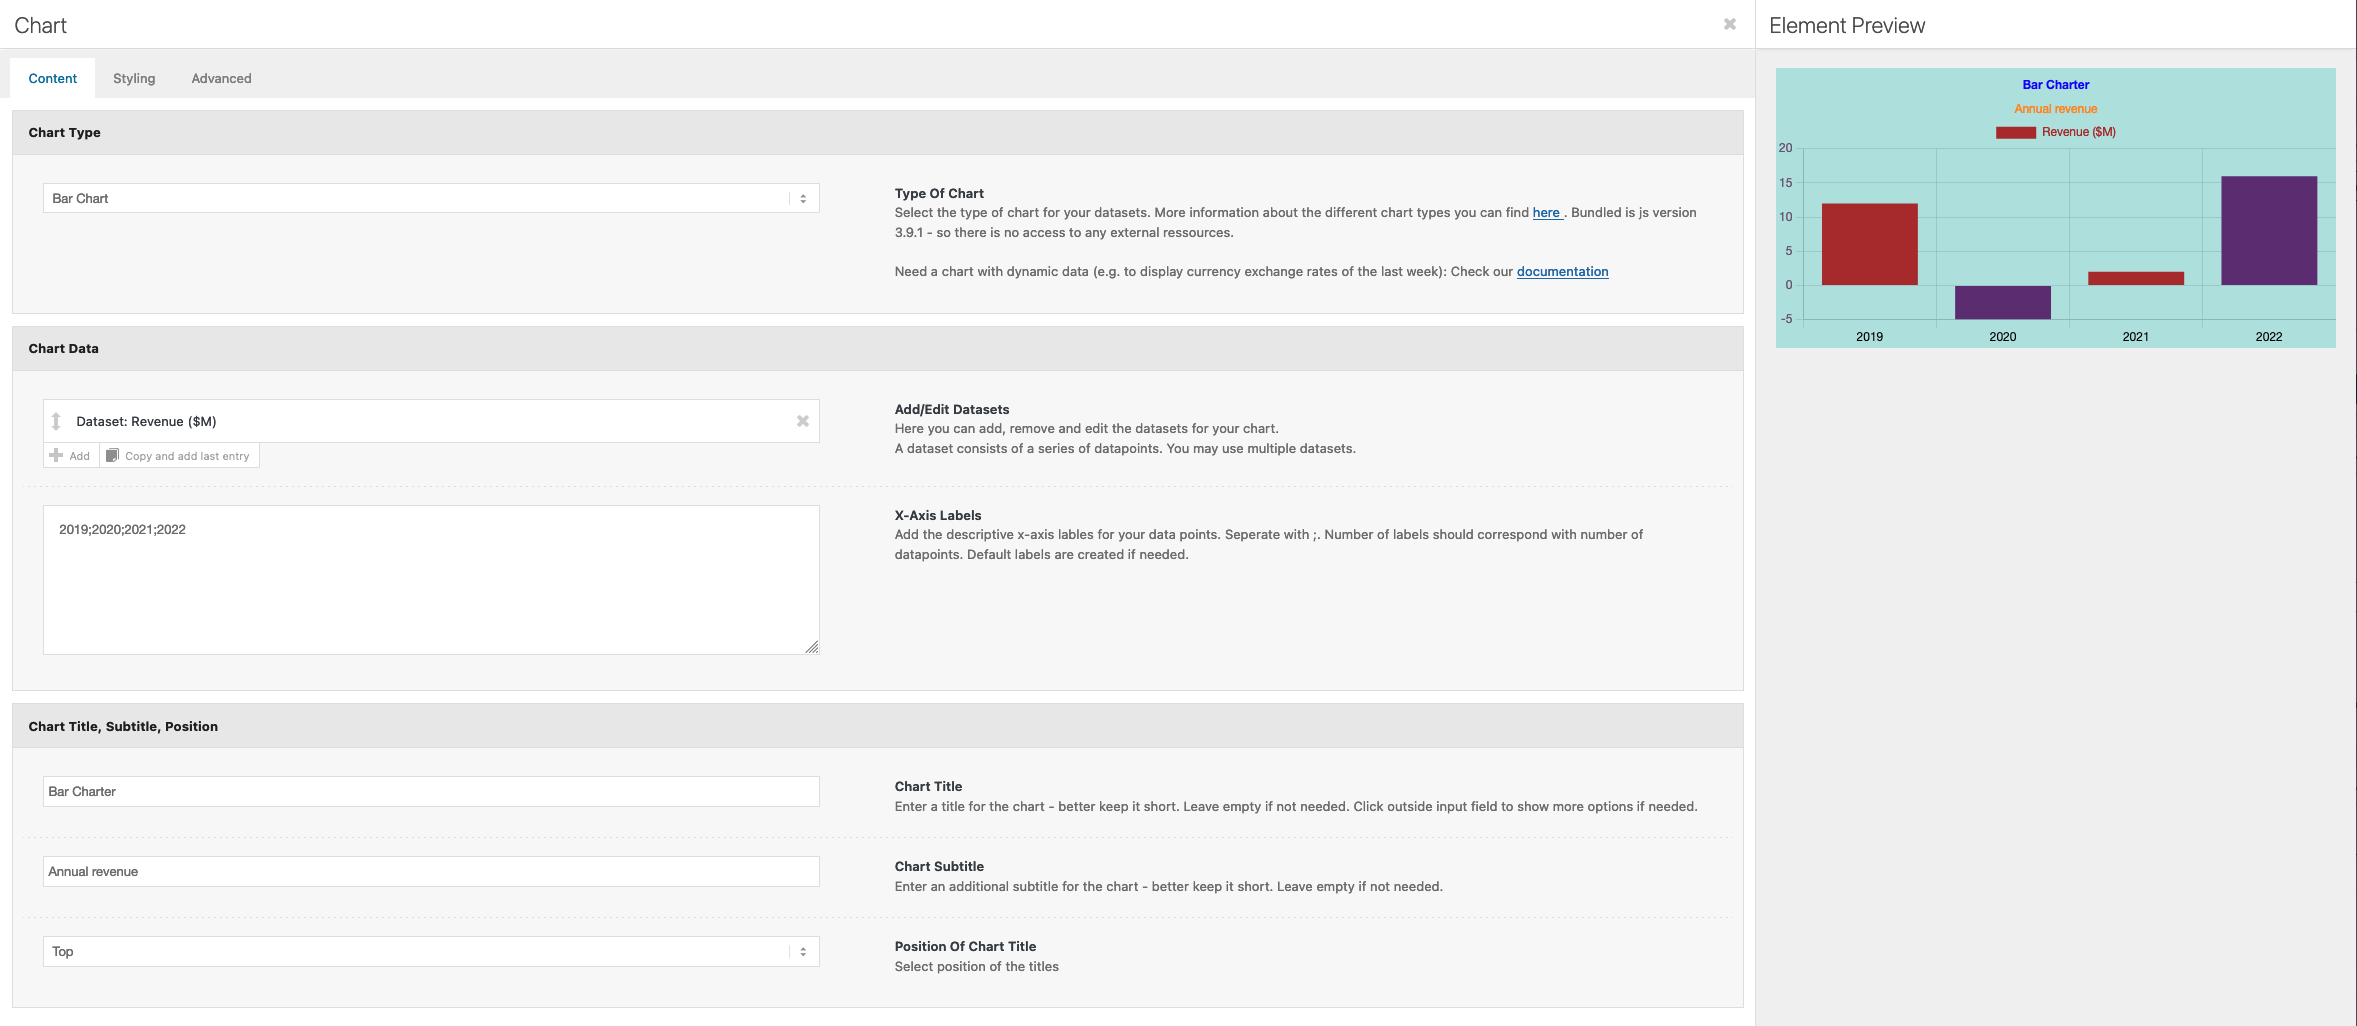
You can change Chart type in Type of Chart field. There are 8 options.
You can add as many datasets as you need under Chart Data section and add descriptions/labels in X-Axis Labels field.
You can change the colors of your chart in Styling tab
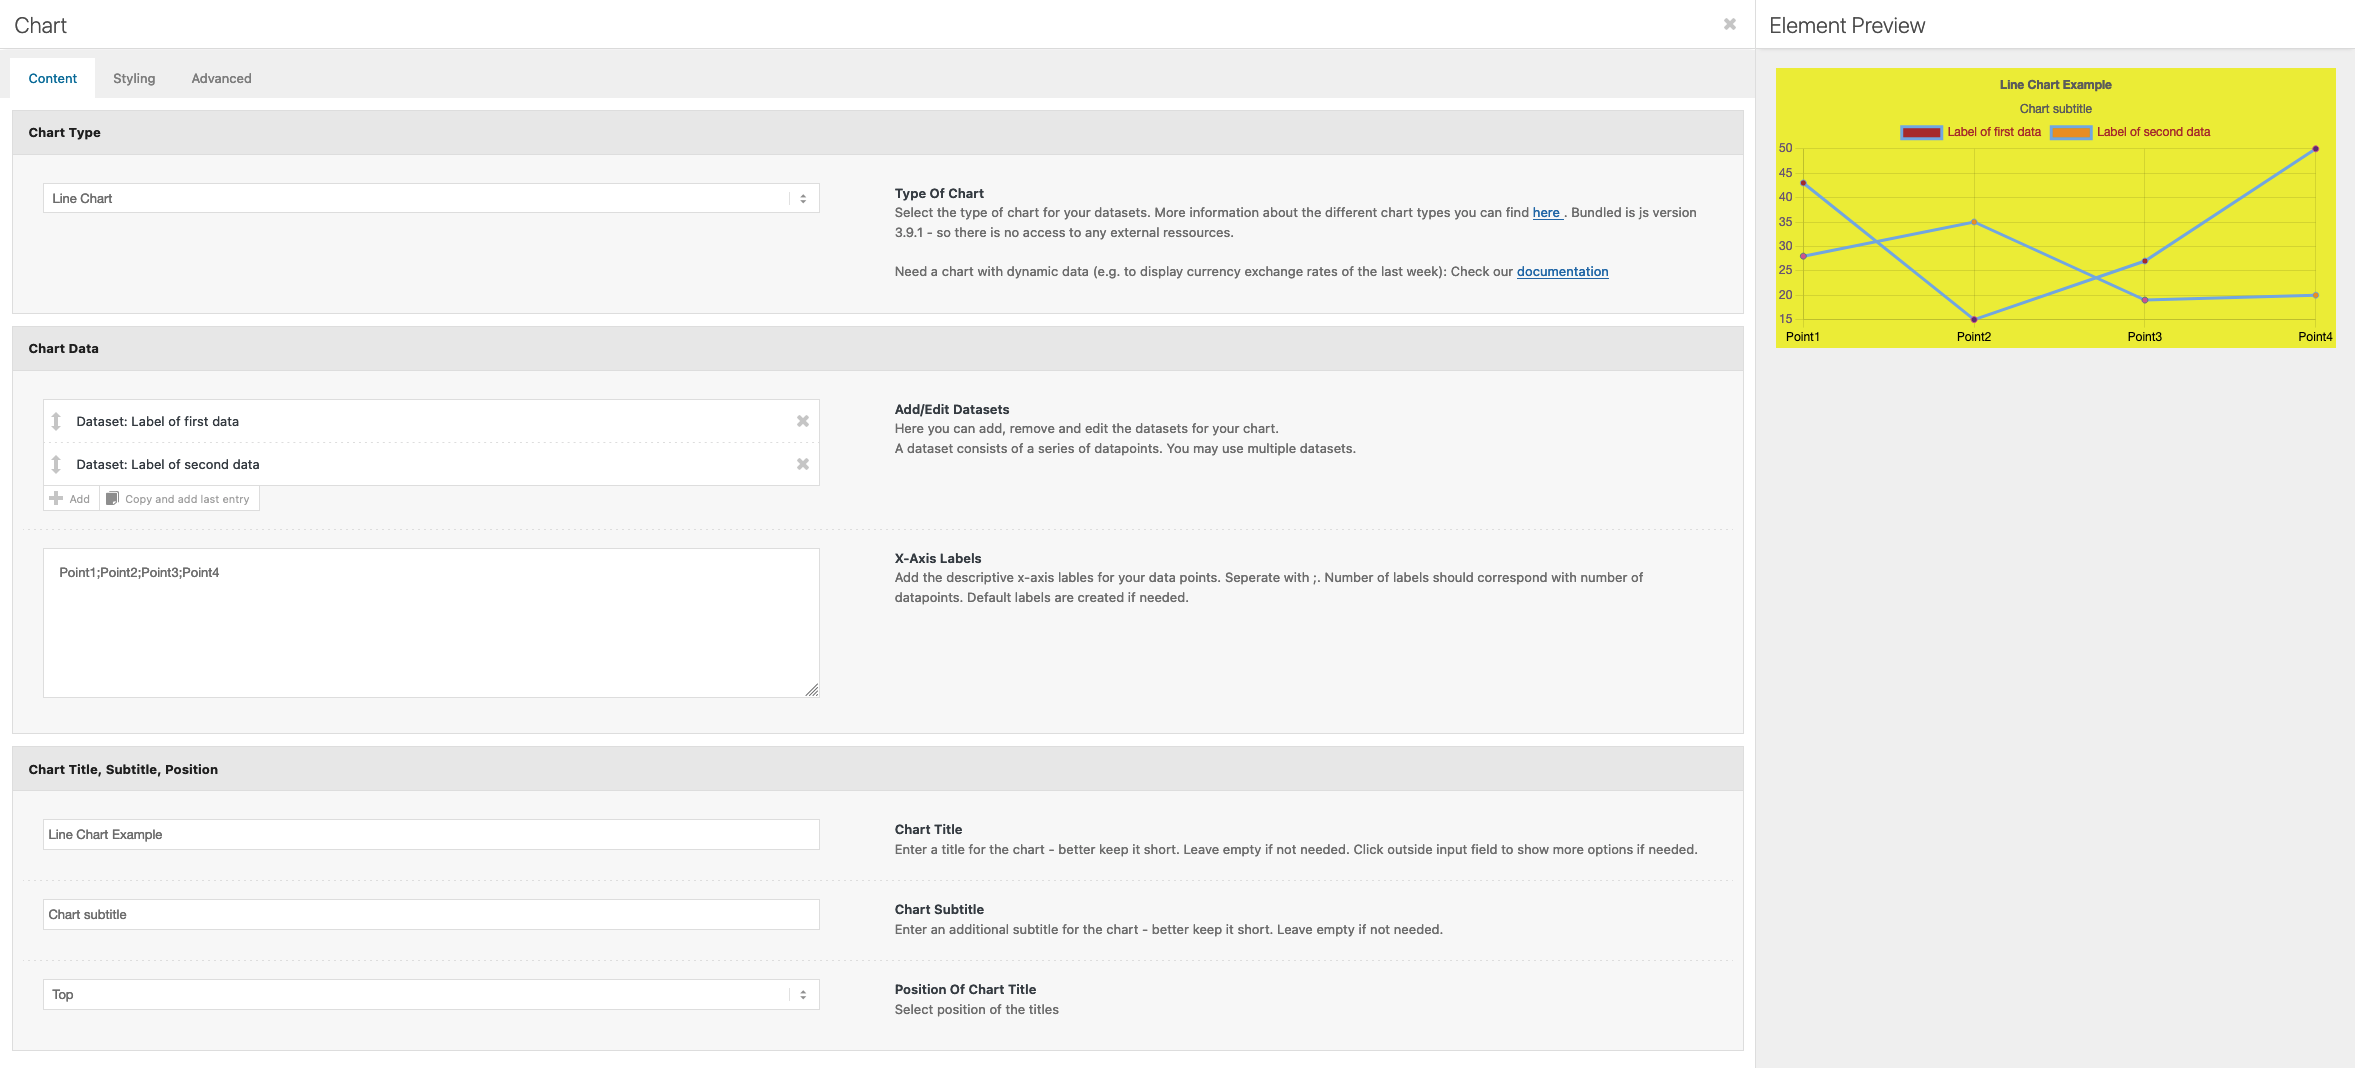
Here is an example with 2 datasets
You can edit your Datasets and go to Styling tab to adjust the colors. Simply pick the colors in color picker, copy their values and paste them into Border/Line Colors or Background Colors fields.
In the following sections we will describe how you can turn this element to display data that is created dynamically during runtime. You have to exclude the page containing this element from caching as the necessary data is rendered in HTML. Depending on the data you want to show you can also invalidate a cached page on an hourly/daily/weekly/… basis only.
Add Dynamic Data Support
The following steps provide an overview but assume you have skills in php, WordPress and know how filters are working. You can find the code snippets in our Library
- We recommend that you use a child theme
- To keep your code seperate from other changes you make to functions.php of the child theme create an own file in the folder (or in a subfolder where you can also place files you need to connect to your data provider)
- Lets say we create
/charts/my_chart_data.php - Inside the file my_chart_data.php add the code to connect to your data provider
- And the code we provide later to add the new data to the chart
To activate your code you have to include the following in functions.php of the child theme:
require_once 'charts/my_chart_data.php';To easily identify a chart on your site we recommend to add a unique id for each chart in Advanced -> Developer Settings -> Custom ID Attribute (e.g. my-chart-1, my-chart-2, ….). Create your chart and setup your datasets, datapoints, … as if it it would be a static data chart. This will be the base to replace the static data with your dynamic data later.
Update ‘Dataset Datapoints‘ of a dataset
A datapoint is a single numeric value (integer, float) except for:
- Bubble Chart: x;y;r where x,y,r is numeric
- Scatter Chart: x;y where x,y is numeric
The new datapoints are placed in an array:
$dp = array( 5, 20, 45 );or e.g. for a bubble chart:
$dp = array( '5;3;2', '20;15;4', '45;25;3' );The following snippet will inject the dynamic dataset points:
/**
 * Filter dataset datapoints and replace with dynamic datapoints.
 * Is called in a loop for every dataset defined in the ALB element.
 *
 * @since 5.3
 * @param array $data			data for dataset provided by ALB Element
 * @param int $index			0 based index of dataset
 * @param array $attr			shortcode attributes array
 * @return array
 */
function my_chart_dataset_data_points( $data, $index, $attr )
{
	//	check if this is a chart to modify (we check only for id="my-chart-1", but any extended logic can be used)
	$id = $attr['id'];

	if( $id != 'my-chart-1' )
	{
		//	return unmodified data
		return $data;
	}

	/**
	 * your_provider_dataset_data_points is a function that connects to your data provider for dataset $index,
	 * places the datapoints in an array and returns it.
	 */
	$data_array = your_provider_dataset_data_points( $index );

	return $data_array;
}

add_filter( 'avf_chart_dataset_data', 'my_chart_dataset_data_points', 10, 3 );
Update ‘Dataset Label‘ of a dataset
The Dataset Label is displayed above the chart and on hover in the tooltip box.
The following snippet will inject the dynamic Dataset Label:
/**
 * Filter dataset label and replace with dynamic label.
 * Is called in a loop for every dataset defined in the ALB element.
 *
 * @since 5.3
 * @param string $dataset_label
 * @param int $index			0 based index of dataset
 * @param array $attr			shortcode attributes array
 * @return string
 */
function my_chart_dataset_label( $dataset_label, $index, $attr )
{
	//	check if this is a chart to modify (we check only for id="my-chart-1", but any extended logic can be used)
	$id = $attr['id'];

	if( $id != 'my-chart-1' )
	{
		//	return unmodified data
		return $dataset_label;
	}

	/**
	 * your_provider_dataset_data_label is a function that connects to your data provider for dataset $index,
	 * gets the label for the dataset and returns it.
	 */
	$label = your_provider_dataset_data_label( $index );

	return $label;
}

add_filter( 'avf_chart_dataset_label', 'my_chart_dataset_label', 10, 3 );
Update X-Axis Labels
The following snippet will inject the dynamic X-Axis Labels:
/**
 * Filter the x-axis labels and replace with dynamic labels.
 *
 * @since 5.3
 * @param array $chart_labels
 * @param array $attr			shortcode attributes array
 * @return array
 */
function my_x_axis_chart_labels( $chart_labels, $attr )
{
	//	check if this is a chart to modify (we check only for id="my-chart-1", but any extended logic can be used)
	$id = $attr['id'];

	if( $id != 'my-chart-1' )
	{
		//	return unmodified data
		return $chart_labels;
	}

	/**
	 * your_provider_chart_x_axis_labels is a function that connects to your data provider,
	 * gets the x-axis labels and returns them in an array.
	 *
	 * e.g.:   array( 'Point1', 'Point2', 'Point3' )
	 */
	$labels = your_provider_chart_x_axis_labels( $attr );

	return $labels;
}

add_filter( 'avf_chart_labels', 'my_x_axis_chart_labels', 10, 2 );
Add More Options – Customize Chart
The chart library provides a lot of more styling and layout features (Chart JS ). You can modify anything you like with a filter.
Our element builds the js config option in php and renders it to the frontend as a json string in a HTML data attribute (data-chart_config) which is passed 1:1 to the js chart object. Be careful not to break anything – there is no further check on the returned object.
To implement a js object
{} use
new stdClass(); To implement a js array
[] use
array(); This is the filter which is called right before the php object is converted to json:
/**
 * Filter the complete config array for the chart. See https://www.chartjs.org/docs/latest/. Make sure not to break the structure.
 * Use \stdClass for js {} and array for js [].
 *
 * @since 5.3
 * @param \stdClass $config
 * @param array $attr
 * @param array $meta
 * @return \stdClass
 */
function my_chartjs_config_object( $config, $attr, $meta )
{
	//	check if this is a chart to modify (we check only for id="my-chart-1", but any extended logic can be used)
	$id = $attr['id'];

	if( $id != 'my-chart-1' )
	{
		//	return unmodified data
		return $config;
	}

	//	add your custom settings in your function my_chart_modify_config
	$new_config = my_chart_modify_config( $config, $attr, $meta );

	return $new_config;
}

add_filter( 'avf_chartjs_config_object', 'my_chartjs_config_object', 10, 3 );


